When it comes to measuring marketing success, it’s tempting to celebrate every spike in traffic or bump in followers. So called vanity metrics like big follower counts, page views, or impressions look nice in a report, but they rarely answer the most important question: Is your marketing driving business growth?
In this article, we’ll break down the digital marketing KPIs that actually matter for growth, highlight the vanity metrics you can stop obsessing over, and give you a clearer path to smarter performance tracking for marketers.
Why Marketing Metrics Can Mislead You
Let’s be honest: numbers are comforting. An uptick in engagement or a sudden surge of new subscribers looks like progress, and it’s easy to point to those charts in a meeting and feel like your efforts are working. The problem is that not all metrics tell the full story, and some can even lead you in the wrong direction.
Here’s why:
- They lack context. A rise in impressions might mean more people are seeing your content, but it won’t lead to sales if they’re not the right people. Without context, metrics can create a false sense of success.
- They reward activity, not outcomes. Marketing teams sometimes fall into the trap of measuring how much they’re doing (posts published, emails sent) instead of what those efforts produce (qualified leads, conversions, revenue).
- They’re easy to manipulate. If the goal is simply to grow vanity metrics, it’s not hard to throw money at ads or giveaways to inflate likes and clicks. However, those inflated numbers rarely translate into ROI.
- They can create misalignment. If marketing celebrates follower growth while leadership focuses on revenue, there’s a disconnect. That disconnect can erode trust in marketing’s value.
The takeaway? Metrics are only meaningful if they’re connected to outcomes that drive the business forward. Without that connection, they can be misleading, making it look like your marketing is working when, in reality, it’s not moving the needle.
Cal Tip: Always ask “so what?” when you see a metric trending up or down. If you can’t tie the answer back to a business outcome (like leads, sales, or customer value), it’s probably not the right metric to focus on.
The Marketing KPIs That Actually Matter
Vanity metrics might grab attention, but they don’t pay the bills. If you want to prove marketing’s impact to leadership (or even just yourself) you need to track numbers that tie directly to leads, sales, and customer retention. These are the KPIs that show your marketing is pulling its weight.
Customer Acquisition Cost (CAC)
How much does it cost to turn a lead into a paying customer? CAC helps you understand if your campaigns are efficient or if you’re overspending.
Example:
Imagine a B2B software company spends $50,000 in a quarter on marketing, including paid ads, email marketing, and content creation. During that time, they acquired 100 new customers.
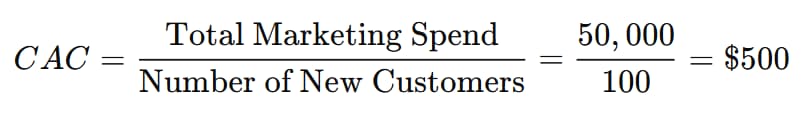
That means it costs $500 to acquire each new customer. This figure helps the company evaluate whether they’re investing in the right channels or overspending for the value each customer brings.
Cal Tip: Don’t just calculate CAC once. Track it across channels. Your social ads, Google Ads, and email campaigns will all have different efficiencies.
Customer Lifetime Value (CLV)
This shows how much revenue a customer is expected to generate during their relationship with your business. If CLV outweighs CAC, you’re in good shape.
Example:
Let’s say that same B2B software company charges $1,000 per year for its product, and the average customer stays for four years.

If the company’s CAC is $500 and their CLV is $4,000, the ratio of return is healthy (roughly 8:1). That balance indicates sustainable growth as long as customer retention remains strong.
Cal Tip: Pair CLV with retention metrics. If your CLV is dropping, it may mean your customer experience needs attention.
Conversion Rates
Forget traffic spikes. How many of your visitors are actually converting into leads or customers? Conversion rate is a far stronger measure of marketing effectiveness than sessions and users.
Cal Tip: Track conversions at multiple points in your funnel – form fills, demo requests, content downloads – not just final sales.
Return on Marketing Investment (ROMI)
For every dollar you spend on marketing, how much revenue do you earn back? ROMI ties marketing directly to business outcomes. For example, calculating return on ad spend (ROAS) helps you more accurately track how you earned from an ad campaign based on every dollar spent.
Cal Tip: If you’re not sure how to calculate ROMI, start small. Pick one campaign, track the spend and revenue generated, and then build from there.
Lead Quality
Ten unqualified leads aren’t better than one strong lead. Quality beats quantity when it comes to filling your pipeline. Chasing big lead numbers can feel productive, but your sales team will waste valuable time if most of those contacts aren’t a fit for your business.
High-quality leads share common traits: they match your target persona, have a real need for your solution, and show intent to buy. Tracking lead quality ensures your marketing efforts are actually bringing in prospects who are likely to convert, not just anyone willing to download a free resource.
Ways to measure lead quality:
- Lead scoring: Assign points based on demographics, engagement, or behavior.
- Sales feedback: Collaborate with your sales team to confirm whether leads passed along are actually sales-ready.
- Pipeline progression: Watch how many marketing-qualified leads (MQLs) progress to sales-qualified leads (SQLs) or opportunities.
Cal Tip: Work closely with sales to create a shared definition of a “qualified lead.” This alignment ensures both teams are focused on the same goal and makes your performance tracking far more accurate.
4 Vanity Metrics You Can Stop Losing Sleep Over
Not all vanity metrics are useless. They just don’t carry much weight when it comes to proving ROI.
These metrics can still provide helpful context, uncover trends, or show how people are engaging with your brand. The problems only occur when these numbers are treated as the end-all-be-all of marketing success.
Here’s how we like to think about them:
- Social Media Followers
A growing follower count shows that your reach is expanding, but it doesn’t tell you whether those followers are your target audience or if they’ll ever become customers. Pair this metric with engagement or conversion data to see if growth translates to business value.
- Page Views
Traffic spikes can be a sign that your content is catching attention, but it’s incomplete without knowing what visitors do once they arrive. Combine page views with bounce rates, time on site, or conversion data to get the bigger picture.
- Likes & Shares
Engagement signals are useful for testing what resonates with your audience, but they don’t necessarily lead to revenue. Treat them as a temperature check. These data points can guide creative direction, but they’re not proof of performance.
- Email Open Rates
Opens are handy for gauging subject line effectiveness and list health, but they don’t prove your email marketing is driving sales. Click-through rates and conversions are far more telling of real impact.
Bottom line: Vanity metrics aren’t worthless, they just need to be put in their proper place. Use them as supporting data points, not your primary proof of success.
The Software Gap: When Tools Don’t Talk
Even the best KPIs can be misleading if the data feeding them isn’t complete. One of the most common pitfalls we see is when a company’s CRM and sales platform don’t communicate well. If marketing tracks leads in one system and sales closes deals in another, gaps and inconsistencies can make it nearly impossible to measure true performance.
For example, let’s say your marketing platform shows 200 “leads generated” from a campaign, but your sales platform only records 50 new customers. Without integration, it’s hard to know how many of those leads actually progressed through the funnel or whether the campaign delivered real ROI.
When your systems don’t talk, you risk:
- Double-counting leads or missing them entirely.
- Losing visibility into where leads drop off in the funnel.
- Misaligning sales and marketing goals, because each team is working with different numbers.
Cal Tip: Before you dive too deep into analyzing KPIs, audit your tech stack. Make sure your CRM, marketing automation tools, and sales platform are synced. Clean, connected data is the only way to trust the KPIs you’re reporting.
Download: How to Choose the Right Digital Marketing Agency
Need helping solving critical marketing gaps that affect your execution, efficiency, and outcomes? Download our guide to learn about key factors that impact which agency is right for your needs.
Performance Tracking for Marketers: Building a Smarter Report
The biggest mistake marketers make with their marketing reports is trying to track everything. A wall of numbers might look impressive, but it usually hides the insights that really matter.
A smart report should strip away the noise and highlight the KPIs that prove whether your marketing truly drives business growth. Here’s what a smart marketing report should include:
- Revenue-driving KPIs: Metrics like CAC, CLV, ROMI, and conversion rates that tie marketing directly to revenue.
- Channel performance: Break down results by channel (email, paid search, organic, social) to see where your best leads and ROI are coming from.
- Funnel visibility: Track how prospects move from awareness to conversion. This helps identify where leads are stalling or dropping off.
- Trend lines, not snapshots: Month-over-month or quarter-over-quarter views give context. A single spike or dip doesn’t tell the whole story.
- Custom segmentation: View data by audience type, campaign, or region so you can see what’s working for different groups of prospects.
When designed well, your insights report becomes less of an arbitrary snapshot and more of a decision-making tool. It helps you answer questions like: Which campaigns are driving the most qualified leads? Where are we overspending? What can we double down on for growth?
Cal Tip: Don’t overcomplicate your report with every available metric. Pick the 5-7 KPIs most closely tied to your goals, then layer in supporting metrics as needed. The simpler your report, the easier it is to actually use.
Turn Metrics Into Meaning
Digital marketing isn’t about looking good on paper, it’s about driving growth. By prioritizing digital marketing KPIs that more accurately tie back to revenue and customer value, you’ll get clearer insights, smarter strategies, and better results. The rest? Leave those vanity metrics for your highlight reel.
If you’re not sure which KPIs to track (or how to connect them to real business results) we can help. Reach out to our team and let’s build a marketing strategy that measures what truly matters.